
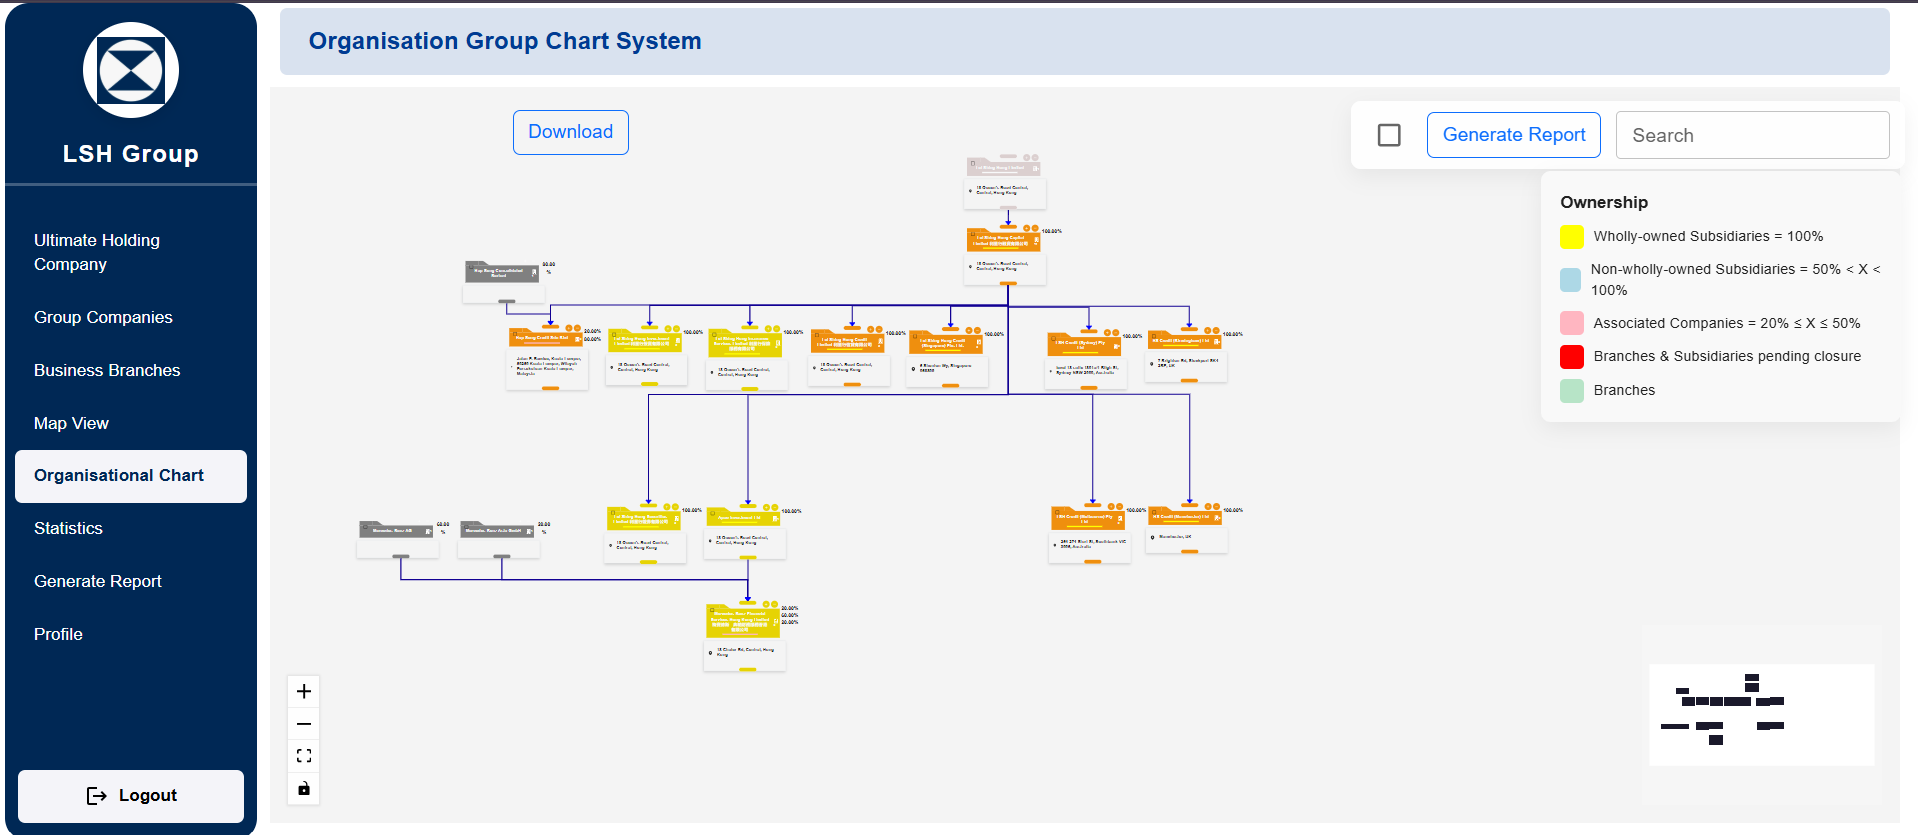
Most companies keep their group structure in two places: a slide deck with boxes and arrows, and a spreadsheet that holds the actual ownership percentages. Both go stale, neither agrees with the other, and nobody can say who changed what. If you are searching for interactive org chart software that holds real corporate data, such as parent-subsidiary links, share structures and stakeholders, and that signs people in through Azure AD, this guide walks through how we built exactly that with React Flow and Node.js, and what to think about before you build your own.
The worked example is the Organizational Hierarchy System, an enterprise platform we built so companies could visualize, manage and track complex corporate structures in one place.
Why static org charts and spreadsheets stop working
The client's problem was not drawing boxes. It was that companies with layered parent-subsidiary structures had no clear way to see ownership percentages, share structures and stakeholder information across the whole group at once. A chart showed shape but no data; a spreadsheet showed data but no shape.
Two further requirements shaped everything that followed:
- Enterprise sign-in. IT wanted Azure AD single sign-on, not yet another standalone username and password.
- Traceability. Every change to the structure needed a recorded history, because ownership data is the kind of thing auditors and lawyers ask about later.
Once you need both a live visual and a system of record, an off-the-shelf diagramming tool usually stops being the right fit. That is the point where a custom build in our custom web development practice starts to make sense.
Choosing React Flow for an interactive org chart
The front end is React 18 with React Flow at the centre. We chose React Flow because an org chart in this context is really a node graph: each company is a node carrying data, and each ownership relationship is an edge. React Flow gives you pan, zoom, drag-and-drop, custom node rendering and viewport control out of the box, and every node is just a React component. That last point matters. A company node can show its name, ownership percentage and a status badge using the same Material-UI components as the rest of the app, rather than drawing on a canvas by hand.
A few practical decisions made the chart usable:
- Automatic layout. Users should not have to position hundreds of boxes. The tree is laid out from the parent-child data, and users can still drag nodes when they want a custom arrangement.
- Unlimited depth. The data model supports unlimited parent-child depth, so a holding company with several tiers of subsidiaries renders the same way as a flat group.
- Custom design. Teams can adjust how charts look, which matters when the chart ends up in a board pack.
D3.js sits alongside React Flow for the visual work where you need lower-level control, and html-to-image handles turning a rendered chart into a PNG. Redux Toolkit holds the shared state (the currently loaded structure, filters, selection), and React Router handles navigation between charts, company profiles and the statistics dashboard.
Modelling companies, ownership and stakeholders
Behind the chart is a MongoDB database accessed through Mongoose. Each company profile stores its details, stakeholders, ownership percentages and share structure, plus a reference to its parent. Business groups and branches are modelled as their own entities so a single company can sit in a legal hierarchy and also belong to a management grouping. A document database suits this well because company profiles vary a lot from one jurisdiction to the next, and a flexible schema avoids a migration every time a new field appears.
The chart is generated from this data, never the other way round. That is the single most important design rule for this kind of system: the visual is a view over the records, so it can never drift out of sync with them.
How to add Azure AD SSO to a React and Node.js app
The platform supports dual authentication: email and password for users outside the corporate directory, and Azure AD SSO for everyone inside it. On the Node.js and Express.js back end, Passport.js handles both strategies. Passport Azure AD validates the Microsoft sign-in, while the local strategy checks email and a Bcrypt-hashed password.
Whichever path a user takes, the server then issues its own JWT. That keeps the rest of the API simple: every protected route checks one kind of token, and role-based access control is applied the same way regardless of how someone logged in. If you are planning something similar, a few points are worth deciding early:
- How identities link. Decide how an Azure AD account maps to an internal user record, typically by matching on a stable identifier from the directory rather than on display name.
- Where roles live. We keep roles and permissions in the application database, so access control does not depend on how a client has configured their directory groups.
- Hardening the API. Helmet sets secure HTTP headers and Express Rate Limit throttles repeated requests, which protects the password login in particular.
Enterprise SSO looks intimidating, but with Passport it is mostly configuration plus a careful user-linking step. For more on integration patterns like this, see our API development and integrations service.
Real-time collaboration, audit trails and reporting
Live updates with Socket.io
Several people often edit a structure at the same time, for example a legal team updating ownership while finance reviews it. The platform uses Socket.io on the server and the Socket.io client in the browser, so when one user changes a company or relationship, the change is broadcast to everyone viewing that structure. This avoids the familiar problem of two people working from different versions of the same chart.
A complete audit trail
Every change is written to an audit trail with history tracking. In practice that means each create, update and delete is recorded with who made it and when, alongside what changed. This is cheap to build at the start and very painful to retrofit, so if your own system touches ownership or governance data, put it in from the first release.
PDF, Excel and PNG exports
Org charts live in meetings, so exports are a core feature rather than an extra. Reports export in three formats: PDF through jsPDF, Excel through the XLSX library, and PNG through html-to-image. Each format serves a different reader. The PDF goes into a board pack, the Excel file goes to whoever needs to reconcile numbers, and the PNG drops into a presentation.
Maps and analytics
Not every question about a group is hierarchical. The React Google Maps API shows where entities are located, with clustering so a map with many offices stays readable. A statistics dashboard summarises the structure for people who want numbers rather than a chart. File uploads, such as supporting documents on a company profile, go through Multer on the Express side.
What to consider before building custom org chart software
We regularly tell clients that a standard HR org chart tool is the better fit if all they need is reporting lines pulled from an HR system. A custom build earns its cost when one or more of these is true:
- You need to track legal entity structure (ownership percentages, shares, stakeholders), not just who reports to whom.
- Your IT team requires Azure AD SSO and role-based permissions that match your governance rules.
- You need an audit trail and exports that stand up to scrutiny.
- The chart has to connect to other internal systems through an API.
If you do build, keep the scope disciplined. Get the data model and permissions right first, then the chart, then collaboration and exports. A beautiful chart over a weak data model is the most common way these projects go wrong. Our guide on signs your business needs a custom system covers the same build-versus-buy reasoning in a CRM context, and most of it applies here too.
Frequently Asked Questions
Is React Flow a good choice for org chart software?
Yes, for interactive charts where nodes carry real data. React Flow treats each node as a React component, so you can render rich company cards, handle drag-and-drop and zoom, and keep the chart in sync with application state. For a purely static diagram it may be more than you need.
Can a web app support both Azure AD SSO and normal email login?
Yes. The Organizational Hierarchy System uses Passport.js with both an Azure AD strategy and a local email and password strategy, then issues the same JWT either way so the rest of the application treats all users consistently.
How deep can a corporate hierarchy go?
In this platform, parent-child depth is unlimited. The practical limit is usually readability, which is why automatic layout, zoom and filtering matter as much as the data model.
Can org charts be exported for board reports?
This system exports to PDF, Excel and PNG, which covers board packs, financial reconciliation and presentations respectively.
You can read the full project summary on the Organizational Hierarchy System case study page. If you are dealing with a group structure that has outgrown spreadsheets and slide decks, talk to us. We will tell you honestly whether an existing tool will do the job or whether a custom build is worth it.